Special Feature - Conservation & Management
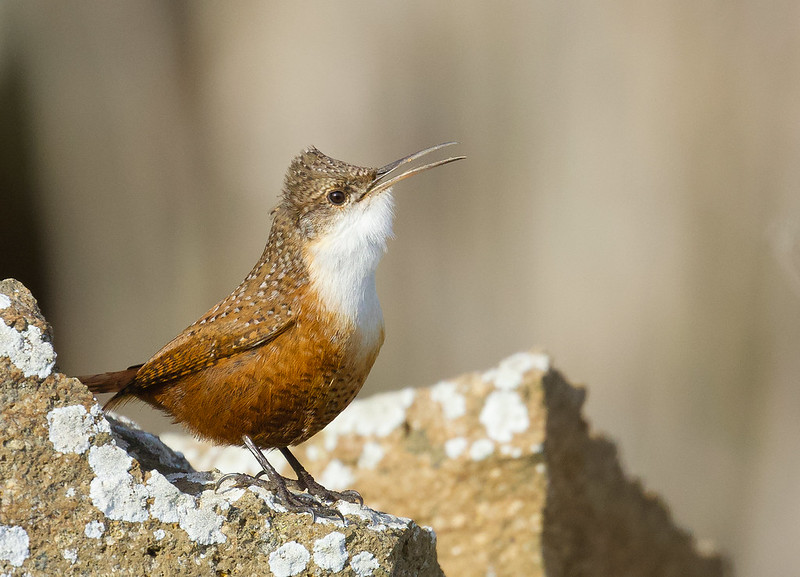
Canyon Wren, a Species of Greatest Information Need in Colorado, by Gregory Smith.
Using IMBCR Trends to Assess the Status of Species across Scales
Bird populations in North America have declined precipitously over the last 50 years (Rosenberg et al. 2019). Monitoring the status of both species of concern and formerly common but declining species is thus an important objective for management agencies. However, while national trends can help inform broad priorities and sound the alarm on range-wide declines, management typically occurs at smaller scales, such as within a National Forest.
The IMBCR program has now collected avian occurrence and density data throughout the western United States for up to 18 years in some regions. These data enable the program to provide critical trend information on bird populations at multiple scales, from individual management units to state or region-wide. Below, we highlight two examples of these data for managers and decision-makers to monitor both existing priority species and common species in decline by accessing data via our recently updated Rocky Mountain Avian Data Center (RMADC). See also Bernath-Plaisted et al. 2025 for additional details about the value of multiscale trends for tracking common species in decline and species of concern, and informing management decisions at relevant scales. We also include an example of Colorado Parks and Wildlife using IMBCR trends to revise their 2025 State Wildlife Action Plan.
The Canyon Wren is not recognized as a species of concern in most western states, although Wyoming Game and Fish Department classified it as a Tier 3 Species of Greatest Conservation Need in 2017. In Colorado, Canyon Wren has declined statewide according to IMBCR trends (about 6% per year since 2008) and these declines are evident on private land and BLM land. However, the cause of these declines is not clear, particularly what could be changing in their preferred habitat of steep, rocky landscapes. Thus, Colorado Parks and Wildlife (CPW) added Canyon Wren to their recently updated State Wildlife Action Plan as a Species of Greatest Information Need. This will allow CPW to further investigate these population losses and determine what management efforts could benefit the species.
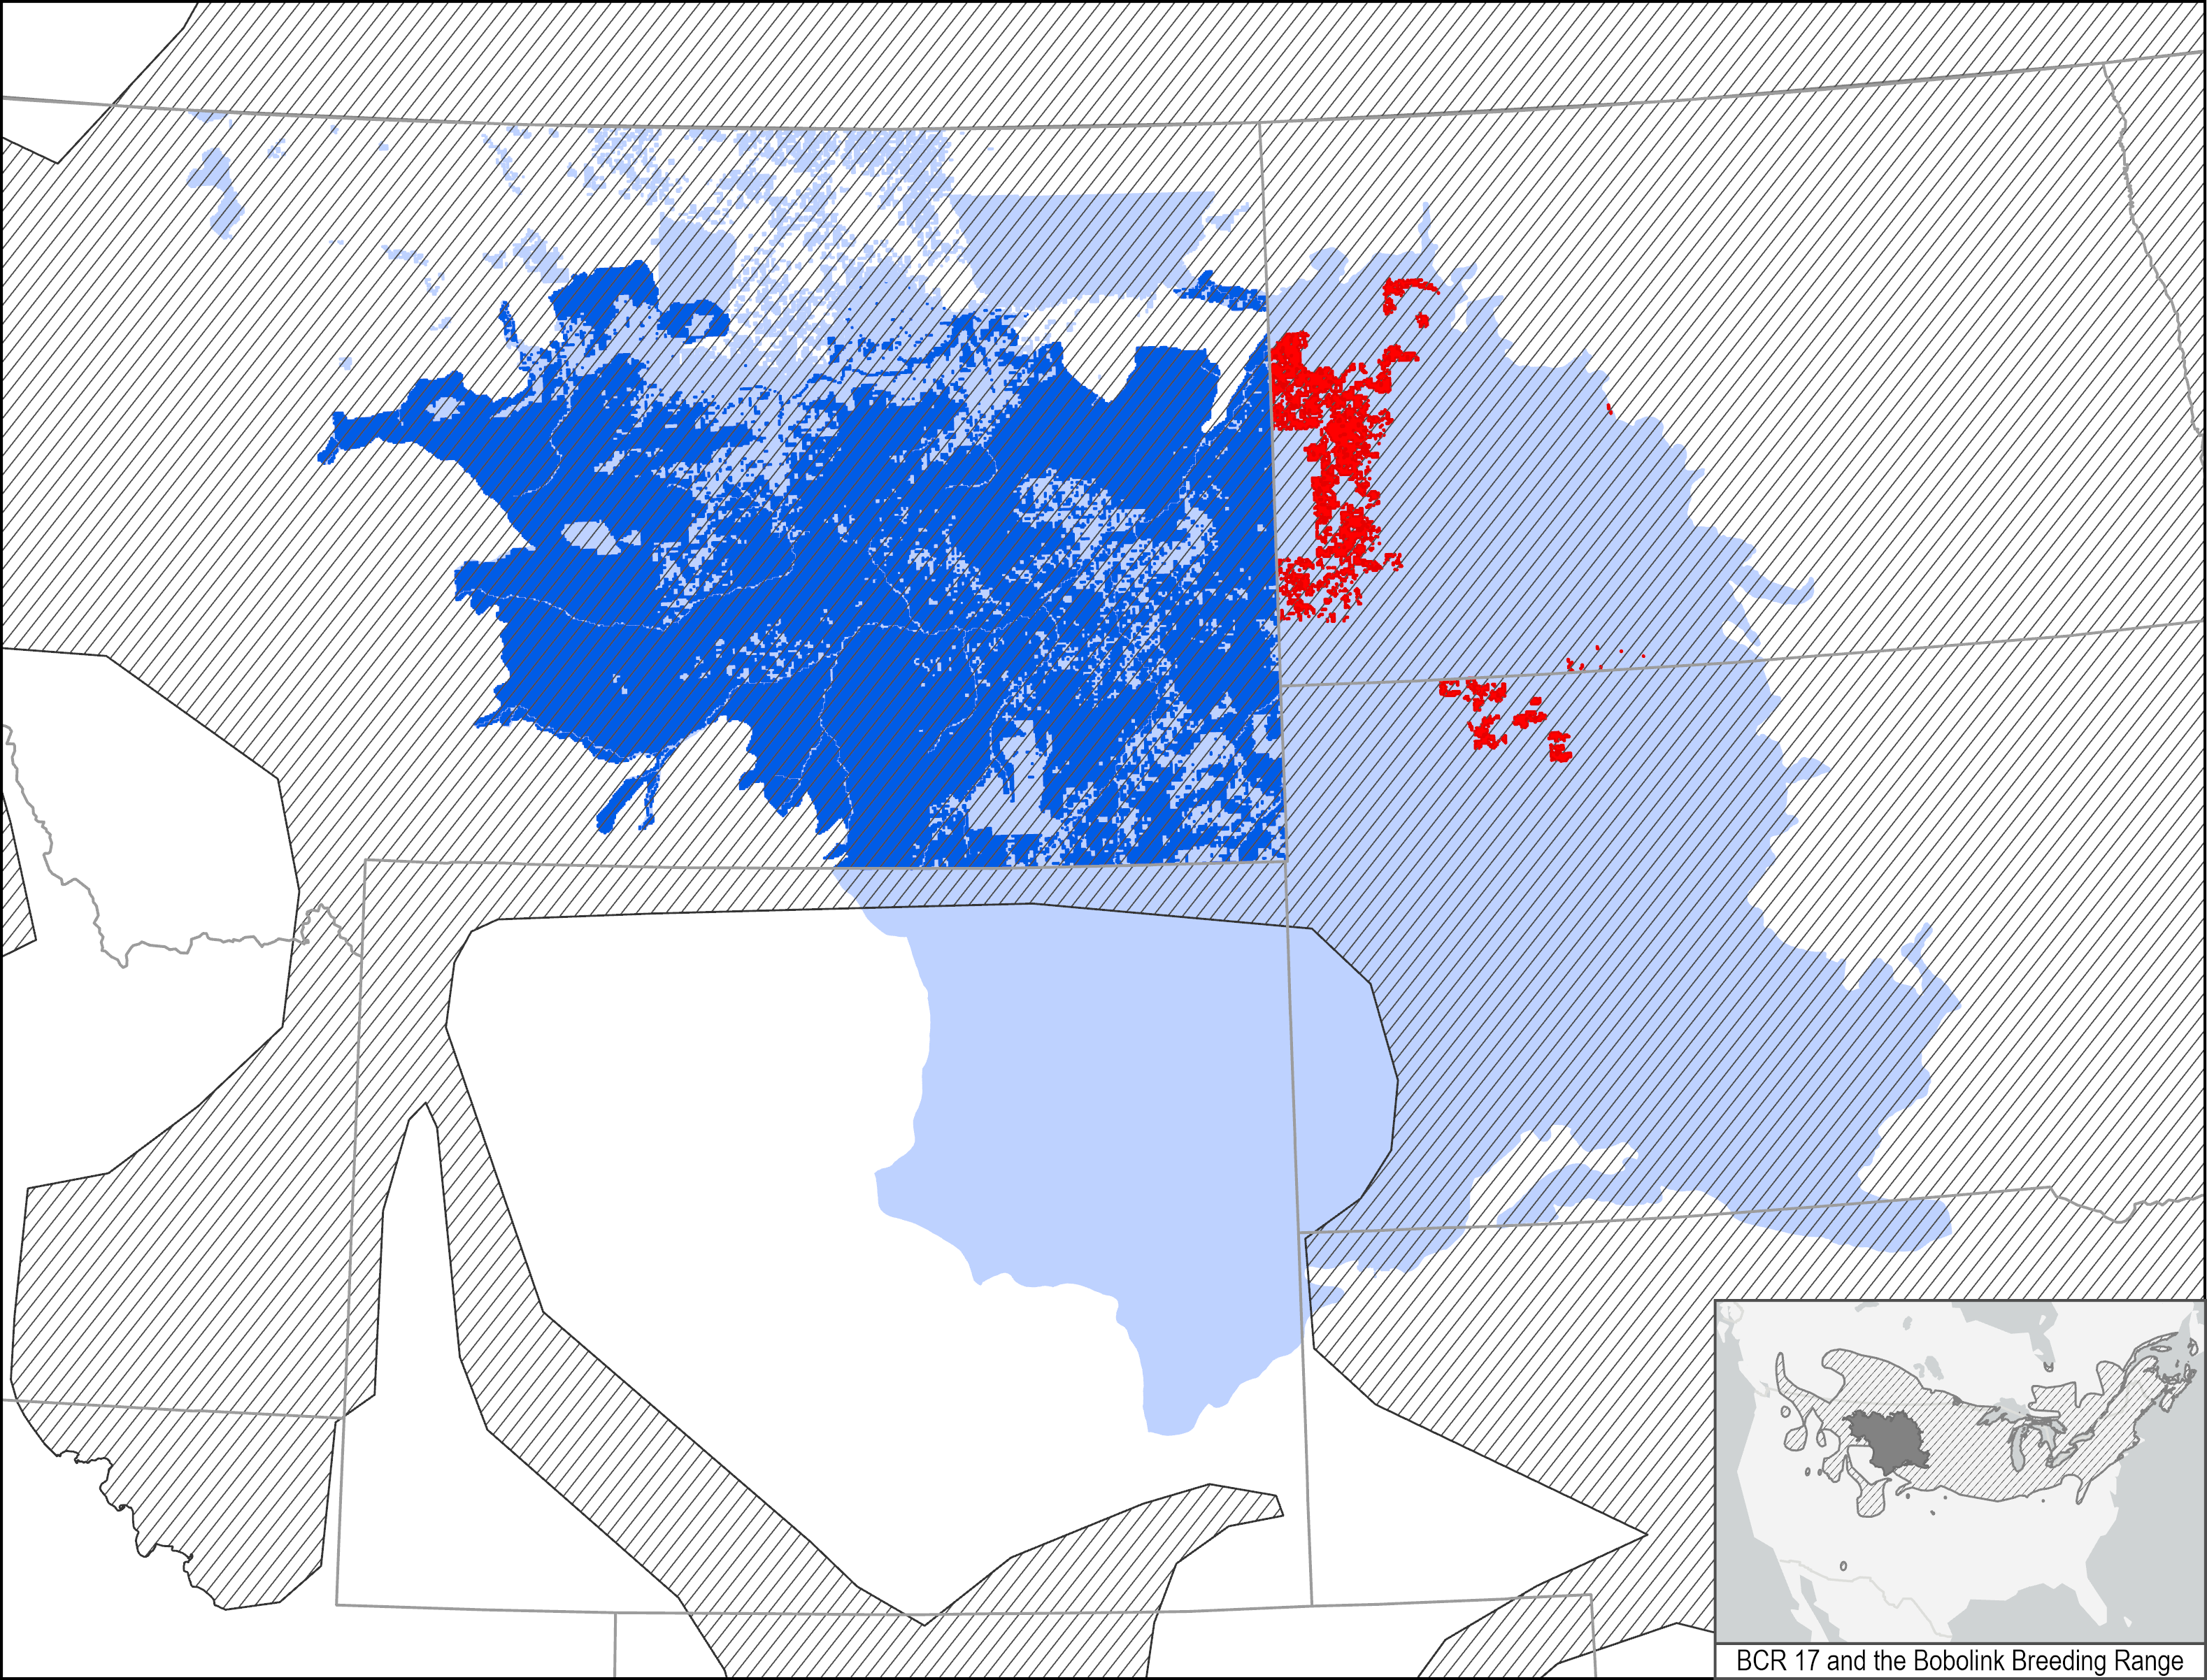
The Bobolink is a grassland-obligate and Road to Recovery tipping point species that has experienced long term population declines (https://r2rbirds.org/tipping-point-species/). Along with other grassland birds, Bobolink populations have faced a loss in habitat from landscape changes, such as agricultural conversion, woody encroachment, and more recently energy development (Bernath-Plaisted et al. 2023). Throughout the Northern Great Plains, IMBCR data show variation in population trends at different scales. For example, populations in some USFS grassland units, like Cedar River National Grassland in North Dakota and Grand River National Grassland in South Dakota, have declined 8-9%/yr since 2013. In southeastern Montana, Bobolink populations have increased 12-16%/yr on privately owned and BLM-managed lands, and at the BCR17-scale, populations have increased about 3%/yr since 2009. Knowing this spatial variation in trend for Bobolink, or other species of concern, can help prioritize management efforts in places with decreasing populations, while targeting increasing populations for grassland conservation (Bernath-Plaisted et al. 2025).
Visit the RMADC to view trends for species of interest in your management area (click on “Explore the Data” to select filters of interest). IMBCR estimates are available for numerous focal areas or “strata”, where partners have invested in monitoring, such as the Bighorn National Forest in Wyoming. The “Superstratum” filter is helpful to find trends for broader regions or statewide (e.g., the BCR18-portion of Colorado) that provide context for individual strata. Filter trends by f-value >0.9 to view only robust estimates; these estimates are highlighted in yellow and estimates with a more stringent threshold of f >0.975 are shown in gold. Increasing trends are highlighted in blue, while decreasing trends are shown in red. Please note, we now provide two trend metrics: trend based on the annual density estimates and trend based on occupancy estimates. Although density and occupancy have different units, trend on either is interpreted the same way: as the percent population change per year during the monitoring period. Visit the “Tutorial” page for additional information on using the site and interpreting the estimates.